Rice Science ›› 2022, Vol. 29 ›› Issue (6): 569-576.DOI: 10.1016/j.rsci.2022.01.011
收稿日期:2021-10-22
接受日期:2022-01-26
出版日期:2022-11-28
发布日期:2022-09-09
. [J]. Rice Science, 2022, 29(6): 569-576.
| Site | Trait | 9311 (Mean ± SD, n = 5) | Backcross inbred line | ||
|---|---|---|---|---|---|
| Mean ± SD (n = 5) | CV (%) | Range | |||
| Ezhou | Pn [µmol/(m2·s)] | 19.90 ± 1.00 | 22.00 ± 5.70 | 25.90 | 10.30-36.20 |
| Gs [mol/(m2·s)] | 0.75 ± 0.06 | 0.68 ± 0.19 | 27.91 | 0.30-1.21 | |
| BM (g) | 41.17 ± 1.11 | 55.89 ± 9.43 | 16.72 | 23.95-89.00 | |
| DBM (g/d) | 0.29 ± 0.01 | 0.39 ± 0.06 | 16.70 | 0.06-0.61 | |
| Lingshui | Pn [µmol/(m2·s)] | 25.00 ± 0.69 | 26.20 ± 3.40 | 12.83 | 17.20-32.60 |
| Gs [mol/(m2·s)] | 0.85 ± 0.13 | 0.80 ± 0.22 | 27.82 | 0.31-1.32 | |
| BM (g) | 33.31 ± 4.75 | 56.25 ± 8.21 | 15.01 | 34.05-73.98 | |
| DBM (g/d) | 0.24 ± 0.03 | 0.41 ± 0.06 | 15.14 | 0.06-0.54 | |
Table 1. Pn and BM of backcross inbred lines in different sites.
| Site | Trait | 9311 (Mean ± SD, n = 5) | Backcross inbred line | ||
|---|---|---|---|---|---|
| Mean ± SD (n = 5) | CV (%) | Range | |||
| Ezhou | Pn [µmol/(m2·s)] | 19.90 ± 1.00 | 22.00 ± 5.70 | 25.90 | 10.30-36.20 |
| Gs [mol/(m2·s)] | 0.75 ± 0.06 | 0.68 ± 0.19 | 27.91 | 0.30-1.21 | |
| BM (g) | 41.17 ± 1.11 | 55.89 ± 9.43 | 16.72 | 23.95-89.00 | |
| DBM (g/d) | 0.29 ± 0.01 | 0.39 ± 0.06 | 16.70 | 0.06-0.61 | |
| Lingshui | Pn [µmol/(m2·s)] | 25.00 ± 0.69 | 26.20 ± 3.40 | 12.83 | 17.20-32.60 |
| Gs [mol/(m2·s)] | 0.85 ± 0.13 | 0.80 ± 0.22 | 27.82 | 0.31-1.32 | |
| BM (g) | 33.31 ± 4.75 | 56.25 ± 8.21 | 15.01 | 34.05-73.98 | |
| DBM (g/d) | 0.24 ± 0.03 | 0.41 ± 0.06 | 15.14 | 0.06-0.54 | |
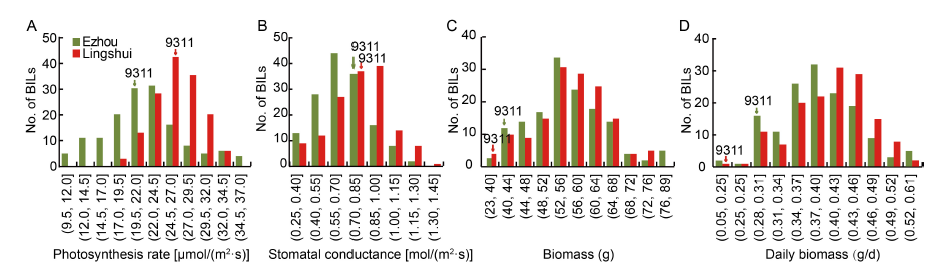
Fig. 1. Frequency distributions of photosynthetic rate (A), stomatal conductance (B), biomass (C) and daily biomass (D) of backcross inbred lines (BILs) in different sites.
| Trait | Pn | Gs | BM | DBM |
|---|---|---|---|---|
| Pn | 0.437** | 0.168* | 0.174* | |
| Gs | 0.588** | -0.042 | -0.022 | |
| BM | 0.202* | -0.049 | 0.988** | |
| DBM | 0.256** | -0.011 | 0.958** |
Table 2. Correlation coefficients among photosynthesis and biomass of backcross inbred lines in Ezhou (upper right) and Lingshui (lower left), China.
| Trait | Pn | Gs | BM | DBM |
|---|---|---|---|---|
| Pn | 0.437** | 0.168* | 0.174* | |
| Gs | 0.588** | -0.042 | -0.022 | |
| BM | 0.202* | -0.049 | 0.988** | |
| DBM | 0.256** | -0.011 | 0.958** |
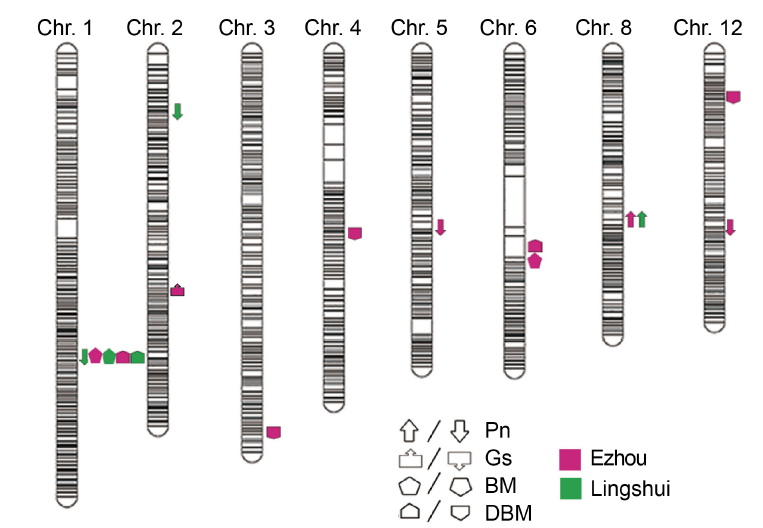
Fig. 2. QTL analysis of photosynthesis of backcross inbred line population in different sites. Upward direction indicates the allele showing positive effects, while downward direction indicates the allele showing negative effects. Pn, Photosynthetic rate; Gs, Stomatal conductance; BM, Biomass; DBM, Daily biomass.
| QTL | Site | Chr. | L/Bin | R/Bin | LOD | PVE (%) | Add |
|---|---|---|---|---|---|---|---|
| qPn1.1 | Lingshui | 1 | 1-143 | 1-144 | 3.5 | 11.9 | -1.1381 |
| qPn2.1 | Lingshui | 2 | 2-25 | 2-26 | 2.9 | 9.2 | -1.1851 |
| qPn5.1 | Ezhou | 5 | 5-86 | 5-87 | 3.1 | 7.9 | -2.6304 |
| qPn8.1 | Ezhou | 8 | 8-85 | 8-86 | 3.6 | 9.2 | 3.2571 |
| Lingshui | 8 | 8-85 | 8-86 | 2.7 | 8.4 | 1.5921 | |
| qPn12.1 | Ezhou | 12 | 12-121 | 12-122 | 2.8 | 7.0 | -1.7882 |
| qGs2.1 | Ezhou | 2 | 2-256 | 2-257 | 3.9 | 11.7 | -0.1334 |
| qBM1.1 | Ezhou | 1 | 1-143 | 1-144 | 3.0 | 8.2 | 3.1844 |
| Lingshui | 1 | 1-143 | 1-144 | 4.5 | 15.0 | 3.6097 | |
| qBM6.1 | Ezhou | 6 | 6-107 | 6-108 | 3.0 | 8.1 | 5.2379 |
| qDBM1.1 | Ezhou | 1 | 1-143 | 1-144 | 4.5 | 8.1 | 0.0243 |
| Lingshui | 1 | 1-143 | 1-144 | 3.4 | 13.0 | 0.0240 | |
| qDBM3.1 | Ezhou | 3 | 3-179 | 3-180 | 2.7 | 4.5 | -0.0326 |
| qDBM4.1 | Ezhou | 4 | 4-99 | 4-100 | 4.4 | 7.7 | -0.0332 |
| qDBM6.1 | Ezhou | 6 | 6-106 | 6-107 | 5.3 | 9.3 | 0.0422 |
| qDBM12.1 | Ezhou | 12 | 12-54 | 12-55 | 3.0 | 5.0 | -0.0173 |
Table 3. QTL information for photosynthic rate and biomass of backcross inbred lines in fields.
| QTL | Site | Chr. | L/Bin | R/Bin | LOD | PVE (%) | Add |
|---|---|---|---|---|---|---|---|
| qPn1.1 | Lingshui | 1 | 1-143 | 1-144 | 3.5 | 11.9 | -1.1381 |
| qPn2.1 | Lingshui | 2 | 2-25 | 2-26 | 2.9 | 9.2 | -1.1851 |
| qPn5.1 | Ezhou | 5 | 5-86 | 5-87 | 3.1 | 7.9 | -2.6304 |
| qPn8.1 | Ezhou | 8 | 8-85 | 8-86 | 3.6 | 9.2 | 3.2571 |
| Lingshui | 8 | 8-85 | 8-86 | 2.7 | 8.4 | 1.5921 | |
| qPn12.1 | Ezhou | 12 | 12-121 | 12-122 | 2.8 | 7.0 | -1.7882 |
| qGs2.1 | Ezhou | 2 | 2-256 | 2-257 | 3.9 | 11.7 | -0.1334 |
| qBM1.1 | Ezhou | 1 | 1-143 | 1-144 | 3.0 | 8.2 | 3.1844 |
| Lingshui | 1 | 1-143 | 1-144 | 4.5 | 15.0 | 3.6097 | |
| qBM6.1 | Ezhou | 6 | 6-107 | 6-108 | 3.0 | 8.1 | 5.2379 |
| qDBM1.1 | Ezhou | 1 | 1-143 | 1-144 | 4.5 | 8.1 | 0.0243 |
| Lingshui | 1 | 1-143 | 1-144 | 3.4 | 13.0 | 0.0240 | |
| qDBM3.1 | Ezhou | 3 | 3-179 | 3-180 | 2.7 | 4.5 | -0.0326 |
| qDBM4.1 | Ezhou | 4 | 4-99 | 4-100 | 4.4 | 7.7 | -0.0332 |
| qDBM6.1 | Ezhou | 6 | 6-106 | 6-107 | 5.3 | 9.3 | 0.0422 |
| qDBM12.1 | Ezhou | 12 | 12-54 | 12-55 | 3.0 | 5.0 | -0.0173 |
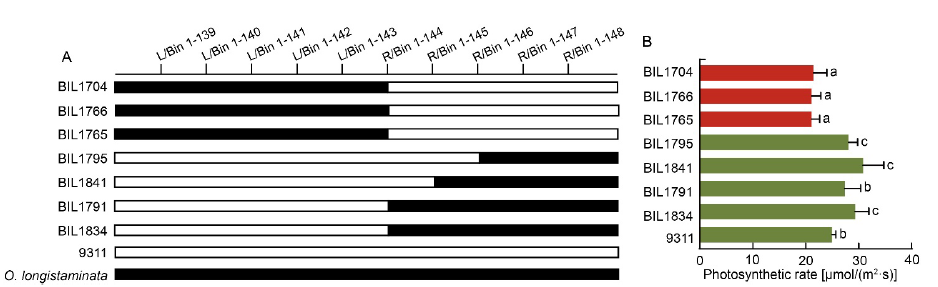
Fig. 3. Validation of function of qPn1.1/qBM1.1/qDBM1.1. A, Comparison of genotypic structure of qPn1.1/qBM1.1/qDBM1.1 locus in different backcross inbred lines (BILs). Black bar and blank bar represent fragments from O. longistaminata and 9311, respectively. B, Photosynthetic rate of corresponding BILs. Different lowercase letters at the top of the bar indicate significant differences among different BILs by the Duncan’s multiple range test at P < 0.05.
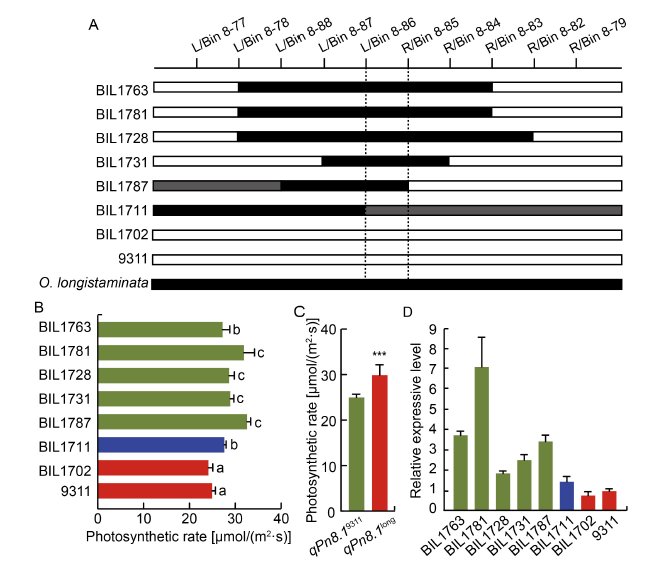
Fig. 4. Validation of function of qPn8.1. A, Comparison of genotypic structure of qPn8.1 locus in different backcross inbred lines (BILs). Black bar and blank bar represent fragments from O. longistaminata and 9311, respectively. Gray bar represents heterozygote genotype. B, Photosynthetic rate of corresponding BILs. Different lowercase letters at the top of the bar indicate significant differences among different BILs at P < 0.05 by the Duncan’s multiple range test. C, Means of Pn of BILs with qPn8.1. ***, Significant difference at P < 0.001 by the Duncan’s multiple range test. D, Relative expression levels of candidate gene ARE1 in different BILs and 9311. In A, B and D, BIL1763, BIL1781, BIL1728, BIL1731 and BIL1787 harbor qPn8.1 from O. longistaminata; BIL1702 does not harbor qPn8.1 as 9311; and BIL1711 is the heterozygote genotype.
| [1] |
Adachi S, Tsuru Y, Nito N, Murata K, Yamamoto T, Ebitani T, Ookawa T, Hirasawa T. 2011. Identification and characterization of genomic regions on chromosomes 4 and 8 that control the rate of photosynthesis in rice leaves. J Exp Bot, 62(6): 1927-1938.
PMID |
| [2] | Adachi S, Ohkubo S, San N S, Yamamoto T. 2020. Genetic determination for source capacity to support breeding of high- yielding rice (Oryza sativa). Mol Breed, 40: 20. |
| [3] | Chang T G, Xin C P, Qu M N, Zhao H L, Song Q F, Zhu X G. 2017. Evaluation of protocols for measuring leaf photosynthetic properties of field-grown rice. Rice Sci, 24(1): 1-9. |
| [4] |
Driever S M, Lawson T, Andralojc P J, Raines C A, Parry M A J. 2014. Natural variation in photosynthetic capacity, growth, and yield in 64 field-grown wheat genotypes. J Exp Bot, 65(17): 4959-4973.
PMID |
| [5] |
Du T T, Meng P, Huang J L, Peng S B, Xiong D L. 2020. Fast photosynthesis measurements for phenotyping photosynthetic capacity of rice. Plant Methods, 16: 6.
PMID |
| [6] | Fan F F, Long W X, Liu M M, Yuan H R, Pan G J, Li N W, Li S Q. 2019. Quantitative trait locus mapping of the combining ability for yield-related traits in wild rice Oryza longistaminata. J Agric Food Chem, 67(32): 8766-8772. |
| [7] |
Foulkes M J, Slafer G A, Davies W J, Berry P M, Sylvester-Bradley R, Martre P, Calderini D F, Griffiths S, Reynolds M P. 2011. Raising yield potential of wheat: III. Optimizing partitioning to grain while maintaining lodging resistance. J Exp Bot, 62(2): 469-486.
PMID |
| [8] |
Furbank R T, Jimenez-Berni J A, George-Jaeggli B, Potgieter A B, Deery D M. 2019. Field crop phenomics: Enabling breeding for radiation use efficiency and biomass in cereal crops. New Phytol, 223(4): 1714-1727.
PMID |
| [9] |
Furbank R T, Sharwood R, Estavillo G M, Silva-Perez V, Condon A G. 2020. Photons to food: Genetic improvement of cereal crop photosynthesis. J Exp Bot, 71(7): 2226-2238.
PMID |
| [10] | Godfray H C J, Beddington J R, Crute I R, Haddad L, Lawrence D, Muir J F, Pretty J, Robinson S, Thomas S M, Toulmin C. 2010a. Food security: The challenge of feeding 9 billion people. Science, 327: 812-818. |
| [11] | Godfray H C J, Crute I R, Haddad L, Lawrence D, Muir J F, Nisbett N, Pretty J, Robinson S, Toulmin C, Whiteley R. 2010b. The future of the global food system. Philos Trans R Soc Lond B Biol Sci, 365: 2769-2777. |
| [12] | Halder T, Hoque M E, Islam M M, Ali L, Chowdhury A K. 2016. Morphomolecular characterization of local Boro rice (Oryza sativa L.) germplasm. Bangl J Plant Breed Genet, 29(2): 1-9. |
| [13] | Haritha G, Vishnukiran T, Yugandhar P, Sarla N, Subrahmanyam D. 2017. Introgressions from Oryza rufipogon increase photosynthetic efficiency of KMR3 rice lines. Rice Sci, 24(2): 85-96. |
| [14] | Huang X H, Kurata N, Wei X H, Wang Z X, Wang A H, Zhao Q, Zhao Y, Liu K Y, Lu H Y, Li W J, Guo Y L, Lu Y Q, Zhou C C, Fan D L, Weng Q J, Zhu C R, Huang T, Zhang L, Wang Y C, Feng L, Furuumi H, Kubo T, Miyabayashi T, Yuan X P, Xu Q, Dong G J, Zhan Q L, Li C Y, Fujiyama A, Toyoda A, Lu T T, Feng Q, Qian Q, Li J Y, Han B. 2012. A map of rice genome variation reveals the origin of cultivated rice. Nature, 490: 497-501. |
| [15] | Huo X, Wu S, Zhu Z F, Liu F X, Fu Y C, Cai H W, Sun X Y, Gu P, Xie D X, Tan L B, Sun C Q. 2017. NOG1 increases grain production in rice. Nat Commun, 8(1): 1497. |
| [16] | Jin J, Long W X, Wang L T, Liu X D, Pan G J, Xiang W, Li N W, Li S Q. 2018. QTL mapping of seed vigor of backcross inbred lines derived from Oryza longistaminata under artificial aging. Front Plant Sci, 9: 1909. |
| [17] | Kartika K, Sakagami J I, Lakitan B, Yabuta S, Wijaya A, Kadir S, Widuri L I, Siaga E, Nakao Y. 2020. Morpho-physiological response of Oryza glaberrima to gradual soil drying. Rice Sci, 27(1): 67-74. |
| [18] | Kazama T, Itabashi E, Fujii S, Nakamura T, Toriyama K. 2016. Mitochondrial ORF79levels determine pollen abortion in cytoplasmic male sterile rice. Plant J, 85(6): 707-716. |
| [19] | Kemanian A R, Stöckle C O, Huggins D R, Viega L M. 2007. A simple method to estimate harvest index in grain crops. Field Crops Res, 103(3): 208-216. |
| [20] | Kim Y S, Kim J J, Park S I, Diamond S, Boyd J S, Taton A, Kim I S, Golden J W, Yoon H S. 2018. Expression of OsTPX gene improves cellular redox homeostasis and photosynthesis efficiency in Synechococcus elongatus PCC 7942. Front Plant Sci, 9: 1848. |
| [21] | Kiran T V, Rao Y V, Subrahmanyam D, Rani N S, Bhadana V P, Rao P R, Voleti S R. 2013. Variation in leaf photosynthetic characteristics in wild rice species. Photosynthetica, 51(3): 350-358. |
| [22] |
Kovach M J, Sweeney M T, McCouch S R. 2007. New insights into the history of rice domestication. Trends Genet, 23(11): 578-587.
PMID |
| [23] | Li S, Tian Y H, Wu K, Ye Y F, Yu J P, Zhang J Q, Liu Q, Hu M Y, Li H, Tong Y P, Harberd N P, Fu X D. 2018. Modulating plant growth-metabolism coordination for sustainable agriculture. Nature, 560: 595-600. |
| [24] | Long S P, Marshall-Colon A, Zhu X G. 2015. Meeting the global food demand of the future by engineering crop photosynthesis and yield potential. Cell, 161(1): 56-66. |
| [25] |
Mann C C. 1999. Genetic engineers aim to soup up crop photosynthesis. Science, 283: 314-316.
PMID |
| [26] | Mao H L, Sun S Y, Yao J L, Wang C R, Yu S B, Xu C G, Li X H, Zhang Q F. 2010. Linking differential domain functions of the GS3 protein to natural variation of grain size in rice. Proc Natl Acad Sci USA, 107(45): 19579-19584. |
| [27] | Masumoto C, Ishii T, Kataoka S, Hatanaka T, Uchida N. 2004. Enhancement of rice leaf photosynthesis by crossing between cultivated rice, Oryza sativa and wild rice species, Oryza rufipogon. Plant Prod Sci, 7(3): 252-259. |
| [28] | Mathan J, Singh A, Jathar V, Ranjan A. 2021. High photosynthesis rate in the selected wild rice is driven by leaf anatomy mediating high Rubisco activity and electron transport rate. J Exp Bot, 72(20): 7119-7135. |
| [29] |
Monna L, Kitazawa N, Yoshino R, Suzuki J, Masuda H, Maehara Y, Tanji M, Sato M, Nasu S, Minobe Y. 2002. Positional cloning of rice semidwarfing gene, sd-1: Rice ‘green revolution gene’ encodes a mutant enzyme involved in gibberellin synthesis. DNA Res, 9: 11-17.
PMID |
| [30] | Omukai S, Arimura S I, Toriyama K, Kazama T. 2021. Disruption of mitochondrial open reading frame 352 partially restores pollen development in cytoplasmic male sterile rice. Plant Physiol, 187(1): 1-11. |
| [31] | Ray D K, Mueller N D, West P C, Foley J A. 2013. Yield trends are insufficient to double global crop production by 2050. PLoS One, 8(6): e66428. |
| [32] |
Reynolds M, Langridge P. 2016. Physiological breeding. Curr Opin Plant Biol, 31: 162-171.
PMID |
| [33] | Richards R A. 2000. Selectable traits to increase crop photosynthesis and yield of grain crops. J Exp Bot, 51: 447-458. |
| [34] | South P F, Cavanagh A P, Lopez-Calcagno P E, Raines C A, Ort D R. 2018. Optimizing photorespiration for improved crop productivity. J Integr Plant Biol, 60(12): 1217-1230. |
| [35] | Sugimoto K, Takeuchi Y, Ebana K, Miyao A, Hirochika H, Hara N, Ishiyama K, Kobayashi M, Ban Y, Hattori T, Yano M. 2010. Molecular cloning of Sdr4, a regulator involved in seed dormancy and domestication of rice. Proc Natl Acad Sci USA, 107(13): 5792-5797. |
| [36] | Sweeney M, McCouch S. 2007. The complex history of the domestication of rice. Ann Bot, 100(5): 951-957. |
| [37] |
Takano-Kai N, Jiang H, Kubo T, Sweeney M, Matsumoto T, Kanamori H, Padhukasahasram B, Bustamante C, Yoshimura A, Doi K, McCouch S. 2009. Evolutionary history of GS3, a gene conferring grain length in rice. Genetics, 182(4): 1323-1334.
PMID |
| [38] | Teng S, Qian Q, Zeng D L, Kunihiro Y, Fujimoto K, Huang D N, Zhu L H. 2004. QTL analysis of leaf photosynthetic rate and related physiological traits in rice (Oryza sativa L.). Euphytica, 135: 1-7. |
| [39] | Thalapati S, Batchu A K, Neelamraju S, Ramanan R. 2012. Os11Gsk gene from a wild rice, Oryza rufipogon improves yield in rice. Funct Integr Genomics, 12(2): 277-289. |
| [40] | Wang Q, Nian J Q, Xie X Z, Yu H, Zhang J, Bai J T, Dong G J, Hu J, Bai B, Chen L C, Xie Q J, Feng J, Yang X L, Peng J L, Chen F, Qian Q, Li J Y, Zuo J R. 2018. Genetic variations in ARE1 mediate grain yield by modulating nitrogen utilization in rice. Nat Commun, 9(1): 735. |
| [41] | Wang Q, Su Q M, Nian J Q, Zhang J, Guo M, Dong G J, Hu J, Wang R S, Wei C S, Li G W, Wang W, Guo H S, Lin S Y, Qian W F, Xie X Z, Qian Q, Chen F, Zuo J R. 2021. The Ghd7 transcription factor represses ARE1 expression to enhance nitrogen utilization and grain yield in rice. Mol Plant, 14(6): 1012-1023. |
| [42] | Yamori W, Kondo E, Sugiura D, Terashima I, Suzuki Y, Makino A. 2016. Enhanced leaf photosynthesis as a target to increase grain yield: Insights from transgenic rice lines with variable Rieske FeS protein content in the cytochrome b6/f complex. Plant Cell Environ, 39(1): 80-87. |
| [43] | Yeo M E, Yeo A R, Flowers T J. 1994. Photosynthesis and photorespiration in the genus Oryza. J Exp Bot, 45(5): 553-560. |
| [44] | Yu J P, Xiong H Y, Zhu X Y, Zhang H L, Li H H, Miao J L, Wang W S, Tang Z S, Zhang Z Y, Yao G X, Zhang Q, Pan Y H, Wang X, Rashid M A R, Li J J, Gao Y M, Li Z K, Yang W C, Fu X D, Li Z C. 2017. OsLG3 contributing to rice grain length and yield was mined by Ho-LAMap. BMC Biol, 15(1): 28. |
| [45] | Zhang S H, He X Y, Zhao J L, Cheng Y S, Xie Z M, Chen Y H, Yang T F, Dong J F, Wang X F, Liu Q, Liu W, Mao X X, Fu H, Chen Z M, Liao Y P, Liu B. 2017. Identification and validation of a novel major QTL for harvest index in rice (Oryza sativa L.). Rice, 10(1): 44. |
| [46] | Zhao M, Ding Z, Lafitte R, Sacks E, Dimayuga G, Holt D. 2010. Photosynthetic characteristics in Oryza species. Photosynthetica, 48(2): 234-240. |
| [47] | Zhu X G, Long S P, Ort D R. 2008. What is the maximum efficiency with which photosynthesis can convert solar energy into biomass? Curr Opin Biotechnol, 19(2): 153-159. |
| [48] | Zhu X G, Long S P, Ort D R. 2010. Improving photosynthetic efficiency for greater yield. Annu Rev Plant Biol, 61: 235-261. |
| No related articles found! |
| 阅读次数 | ||||||
|
全文 |
|
|||||
|
摘要 |
|
|||||